Create a free profile to get unlimited access to exclusive videos, sweepstakes, and more!
The sky is filled with warm, fuzzy gas

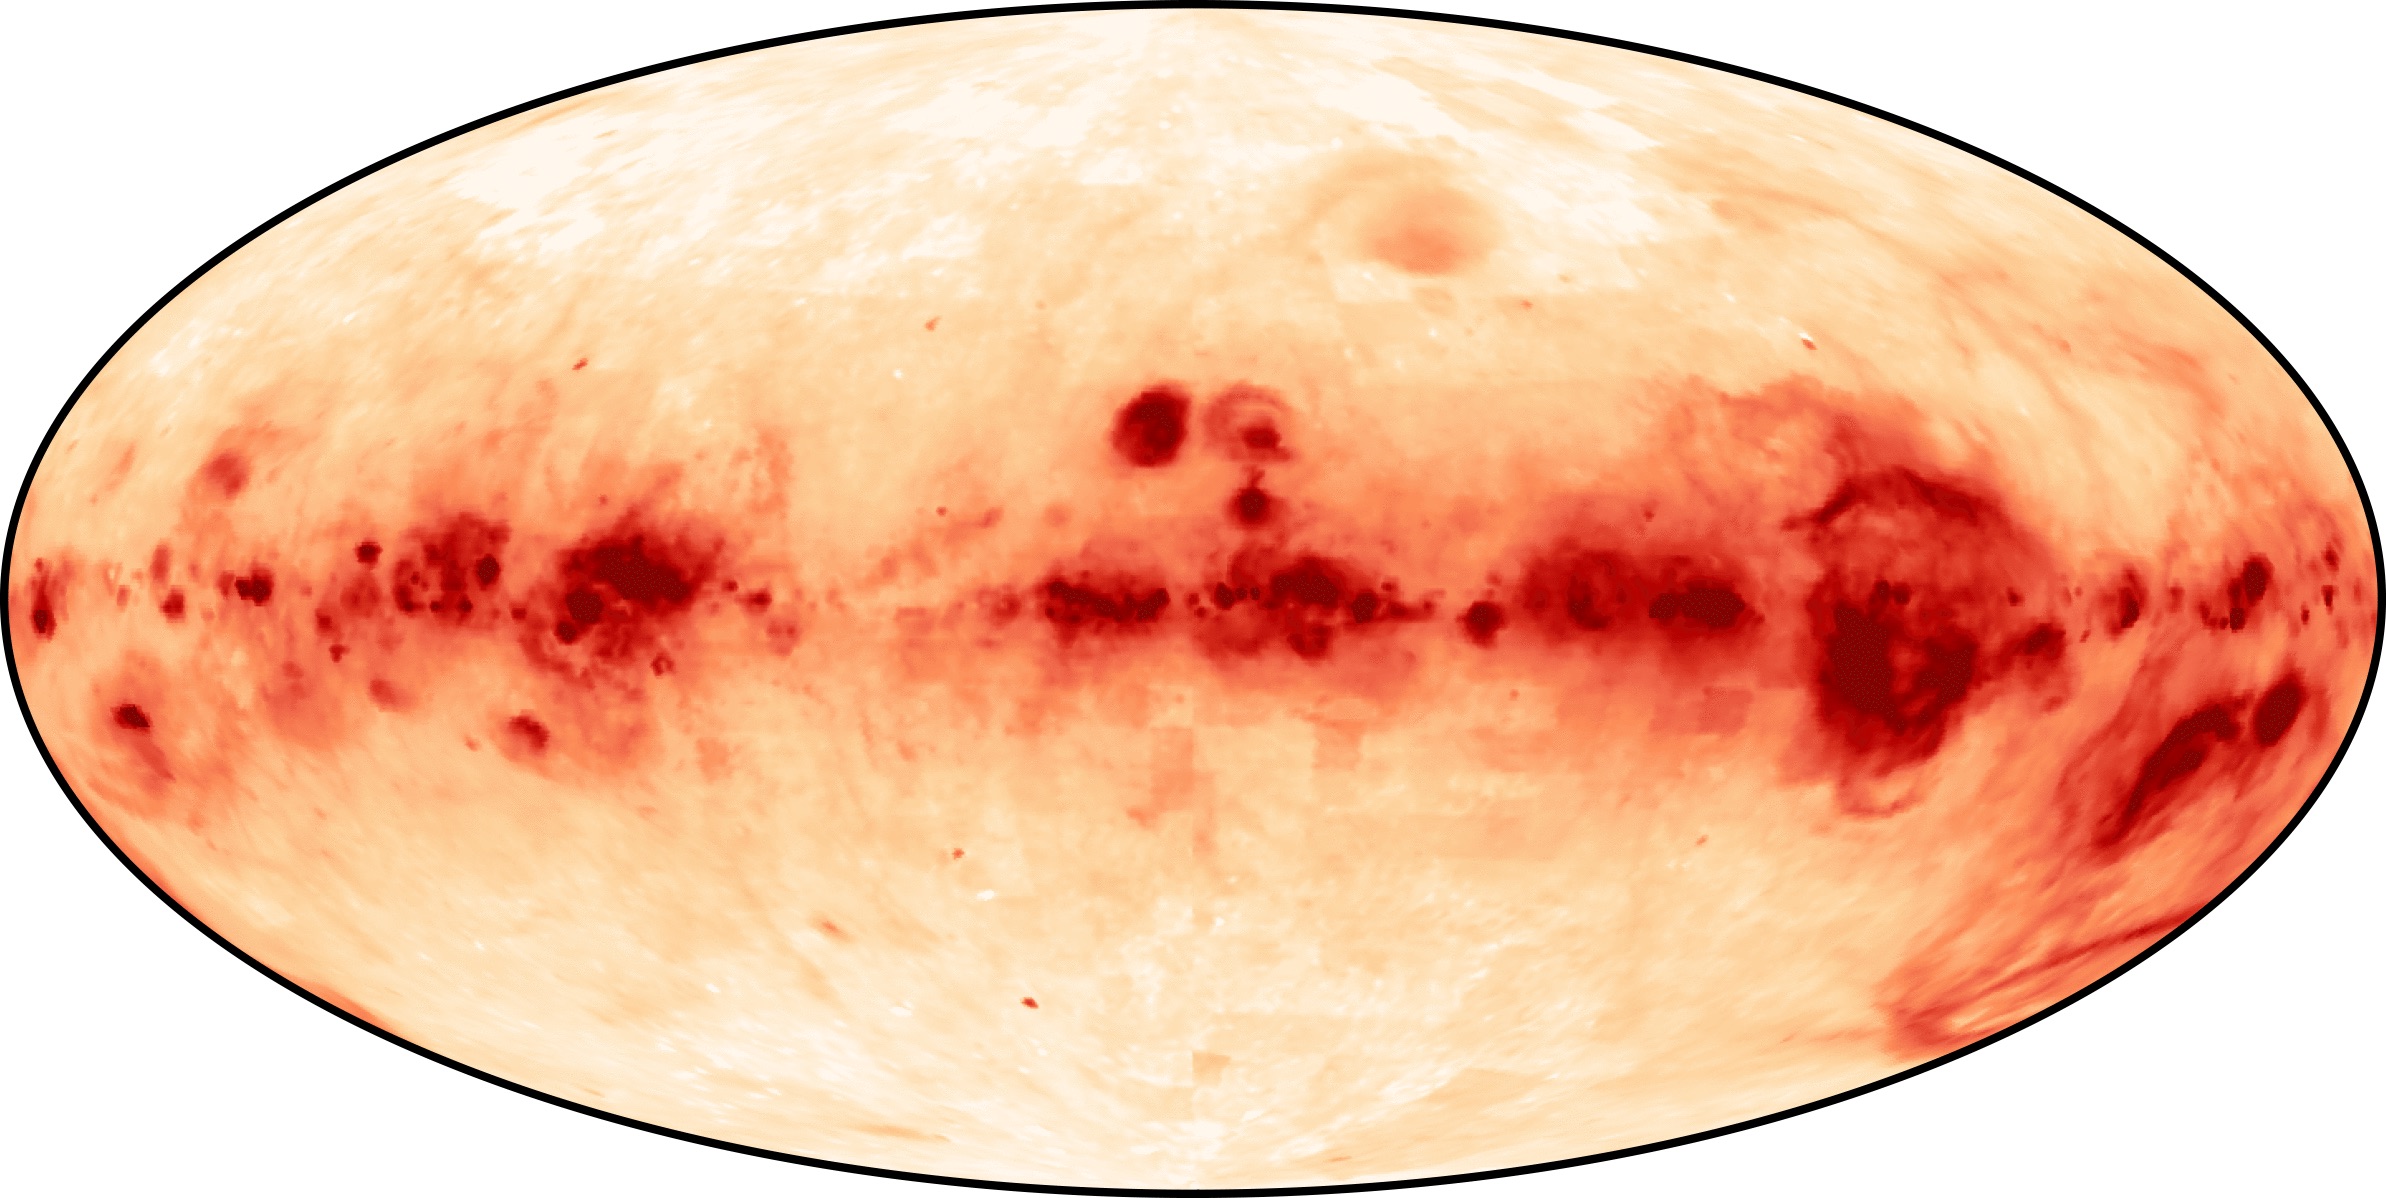
[Credit: WHAM Collaboration, UW–Madison, Space Science Institute & National Science Foundation]
One of my favorite things is to learn something new. Especially when it’s something big.
In this case, I mean it literally: The galaxy is filled with warm, ionized hydrogen gas, it forms a huge pancake-like structure 75,000 light years across and more than 6000 light years thick, and it has a name: the Reynolds layer. Even better, when it was discovered, it was a shock, briefly defying explanation until better physical models of the galaxy made it more clear.
“Clear”. Heh. That’s a pun. I’ll explain in a moment. But first, a picture. Well, more of a map:

That is a map of the entire sky, showing that gas. It’s not terribly high spatial resolution (that is, able to distinguish one spot in the sky near another), but it’s a powerful map nonetheless, showing us a whole part of the Milky Way we didn’t know about very well before.
The Milky Way is our home galaxy, a vast, sprawling disk of gas, dust, and stars surrounded by dark matter. The Sun and planets in our solar system sit about halfway out from the center to the ill-defined edge, roughly in the midplane of the disk, vertically.
When we look into the galaxy, we see all that gas and dust. In visible light, the dust is dark, opaque, absorbing light from stuff behind it. We see it in silhouette against brighter background material, though in some cases we see it faintly illuminated by background starlight, or, in very rare cases, reflecting blue light by nearby bright stars.
The gas, we tend to see only near very bright stars. The vast majority of this material is hydrogen, and it’s generally thinly spread around. It does tend to clump up in some places, and we call these nebulae. If the gas is dense enough, a cloud of it can collapse under its own gravity to form stars. The most massive, hottest stars then light this gas up, energizing it, ionizing it (that is, causing each atom to lose an electron), causing it to glow. We call this an emission nebula.
You’ve seen lots of pictures of these. The Orion Nebula, the Tarantula Nebula, the Eta Carina Nebula...they’re very pretty, and very bright.
But they’re not very big. Sure, they’re dozens of light years across, but the galaxy is a hundred thousand light years across. These nebulae are bright because they have those hot stars inside them. Once you get far enough from those stars, their radiance dims, and they lack the oomph needed to light up the gas. That gas, strewn between the stars, is cooler, darker, and unionized (or neutral).
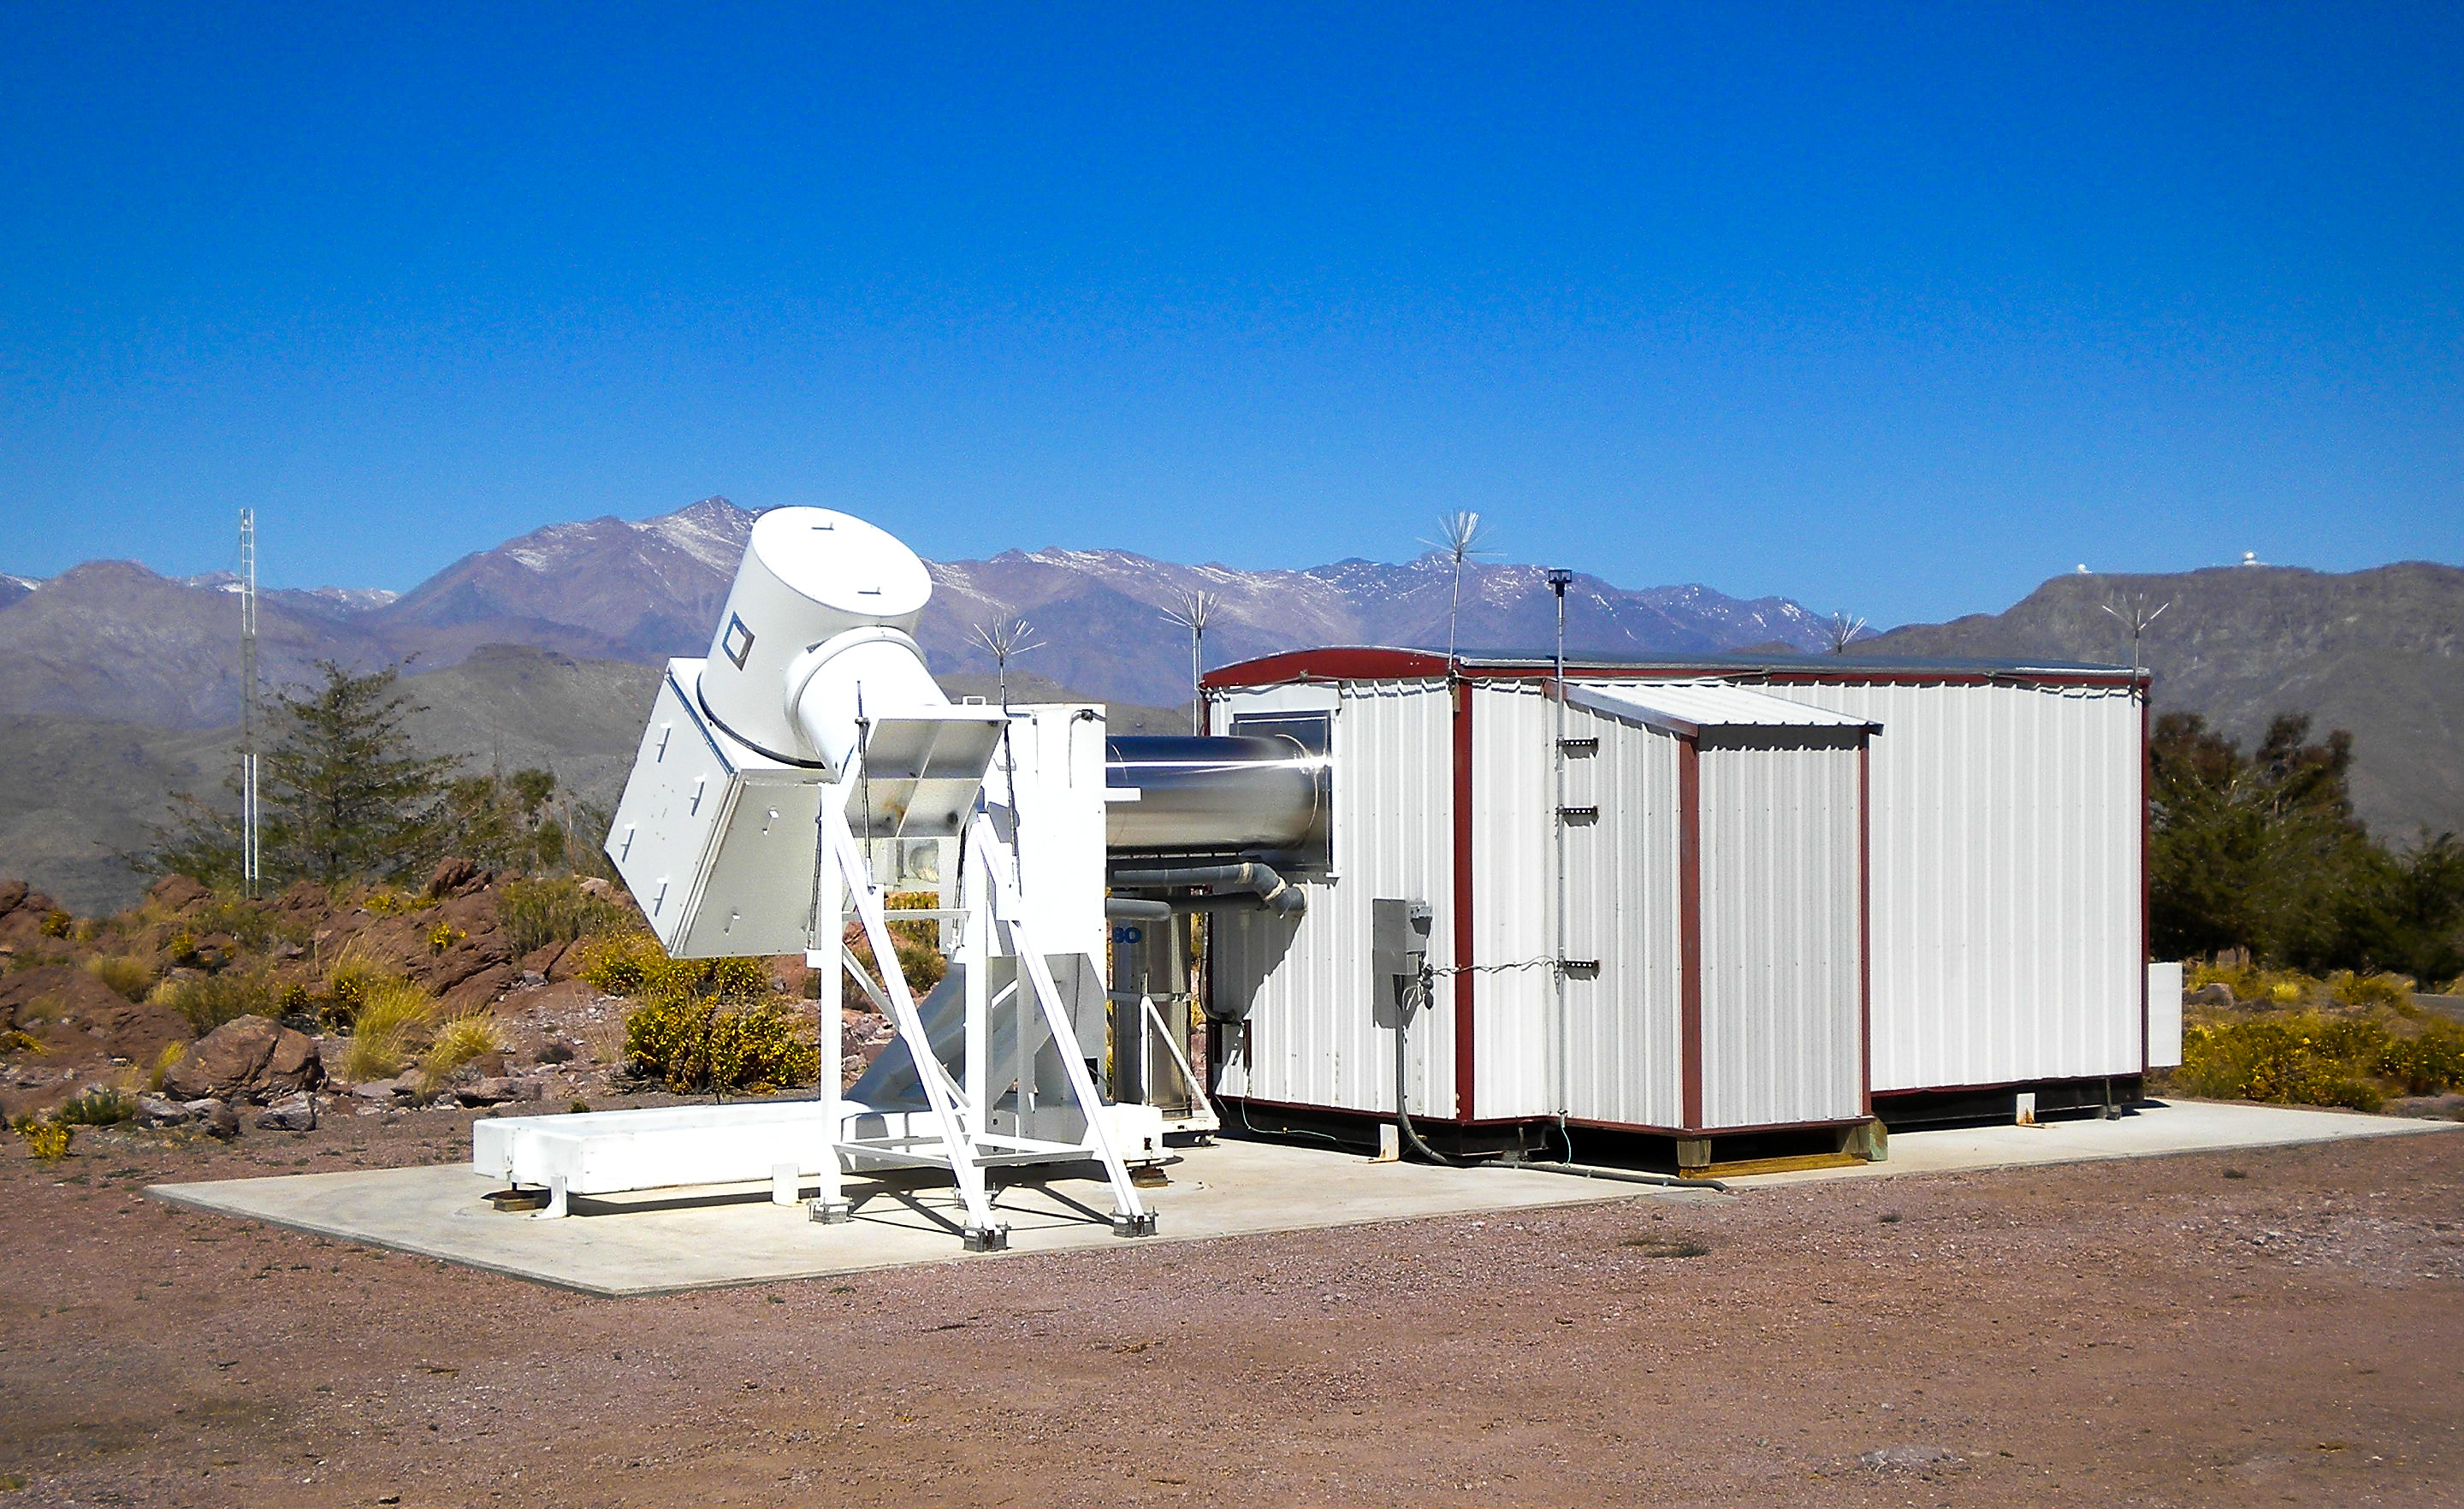
Or so I thought until today. Then, I read about WHAM— the Wisconsin H-Alpha Mapper. It’s a small telescope with a dedicated high-resolution spectrometer attached to it. Light that hits this instrument is broken up into very narrow slices of colors centered on a very particular color: The red light emitted by warm hydrogen.

I describe how this works in Crash Course Astronomy: Light, but in synopsis, when starlight hits a hydrogen atom, the electron absorbs that light and jumps up to a higher energy level in the atom. Sometimes, it gets so much energy (usually ultraviolet light from massive stars), it’s blasted away from the atom like shrapnel — it’s ionized. When the electron recombines with the atom, it jumps down a series of steps, emitting light at very specific wavelengths (colors). One of these steps emits light at a wavelength of 656 nanometers, which is red. We call that H-alpha, and when we see it, we know that hydrogen gas is being pumped full of energy.
WHAM is very sensitive to this light, so much so that it can precisely measure the Doppler shift in the color if the gas is moving toward or away from us, too. As a final plus, it sees huge areas of the sky at the same time, regions about a degree on a side (larger than the full Moon), so, over just a few years, it can map this gas and its velocity over the entire sky. It began its survey in Arizona, and then was moved to Chile to get the southern skies, as well.
The map shows all the H-alpha emission in the sky, centered near Orion (if you saw my recent post on Orion, the bright splotch just below center left is the Lambda Orionis nebula, with Barnard’s Loop with the Orion Nebula nestled in it just to the left of that). It shows all the gas with a velocity between 10 kilometers per second toward or away from us. The brightest spots are where stars are actively being born, and many of the loops and circles you see are from either the powerful winds of young stars or the expanding debris from supernova explosions. But, as you can see, the gas itself is everywhere, all over the sky!
That was a pretty big surprise when it was first discovered. We knew gas was everywhere, but we thought the ionized stuff would only be near bright stars. The original WHAM observations showed that was wrong, and that somehow even remote gas was getting energized. But how?
At first, models of the gas showed that stars couldn’t be doing it; the material in between stars was so thick that the ultraviolet light from those stars couldn’t penetrate very far. But those models were too simple; when they modeled the geometry more closely, astronomers found that exploding stars blew material out that generated turbulence in the gas, making big voids that allowed the UV light to go farther (like waving away smoke in front of your face so you can see better). This light rapidly gets weak with distance, but it’s enough to cause the material to glow faintly far from the source of energy. It looks like most of the galaxy is filled with this gas, then, in a pancake-like structure.
And all this was undiscovered until astronomer Ron Reynolds thought to look for it. He found it using a much simpler device in the 1970s, then went on to build WHAM. The structure is named after him.
I like stories like this a lot. Here was something not only unknown, but actively thought not to exist because there was too much stuff blocking the starlight (which is why I said “clear” was a pun way back at the beginning of this article; the layer is possible because supernovae cleared out enough material for the starlight to get through, making the galaxy more transparent). And now we can map it, and those maps can be used for a large number of scientific studies. Where is gas denser, or moving more rapidly? How many supernovae do you need to clear the path, and what does that say about the opaque material? How does this relate to star formation and other processes in the galaxy?
There are always more questions, but these maps will help answer them. And I’m really happy I found out about this myself; I wasn’t aware of it previously. Yesterday, I didn’t know the sky was filled with warm, ionized hydrogen gas. Now, I do. That’s cool.


